Analytics DashboardNew
See how your courses are performing at a glance — enrollments, students, content counts, and more — with metric cards, an enrollment chart, date filters, and printing.
The Analytics Dashboard is the first screen you see in Masteriyo. It gives you an at-a-glance view of how your site is doing — how many courses, students, and enrollments you have, plus an enrollment trend over time. You can switch the metrics shown, change the date range, focus on a single course, and print the view.
Metric cards
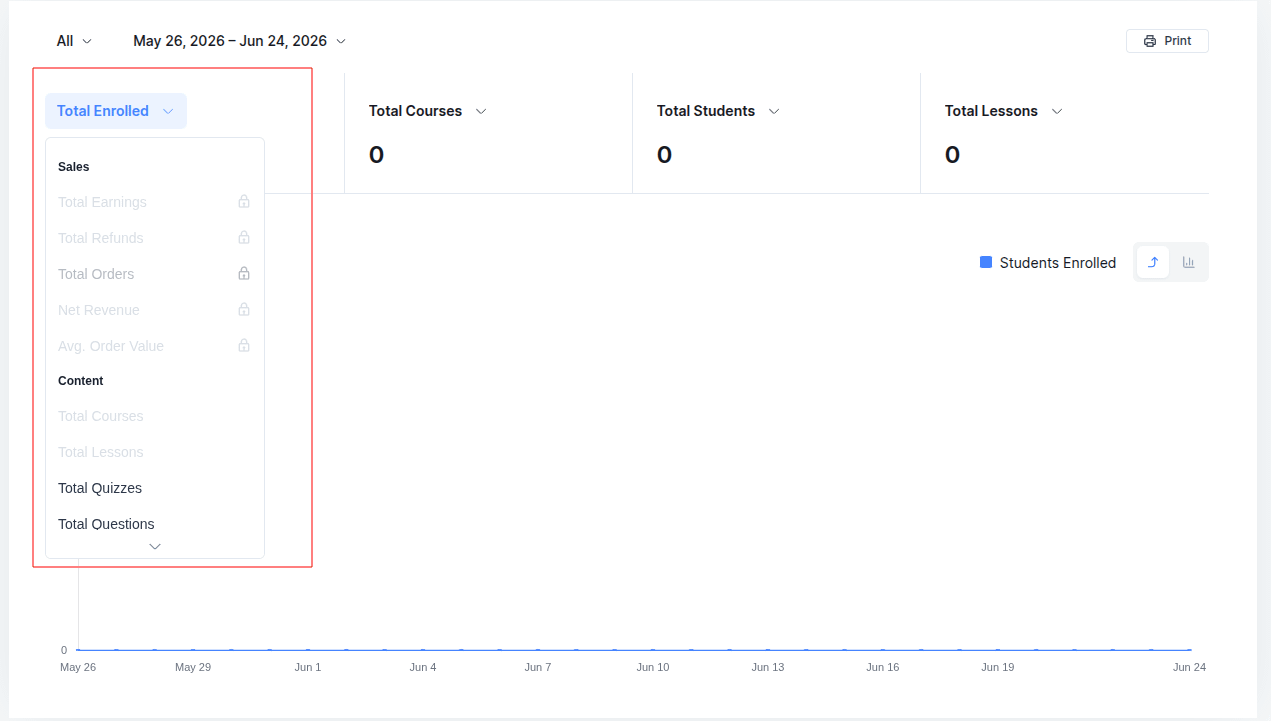
The top of the dashboard shows four metric cards — each one a single number, like Total Students or Total Enrolled. By default they show Total Enrolled, Total Courses, Total Students, and Total Lessons. You can change what any card shows: click the card's title to open a dropdown, where metrics are organized into groups, then pick the one you want.
In the free version these metrics are available:
| Group | Metrics |
|---|---|
| Content | Total Courses, Total Lessons, Total Quizzes, Total Questions |
| People | Total Enrolled, Total Students, Total Instructors |
| Engagement | Total Q&A, Total Reviews |
Note: A Sales group (Total Earnings, Total Refunds, Total Discounts, Total Orders, Net Revenue, Avg. Order Value) also appears in the dropdown, but those metrics need Pro. They show with a lock until you upgrade.
The enrollment chart
Below the cards is the Enrollment chart — it plots Students Enrolled over the selected date range so you can spot trends. Use the toggle to switch between a line and a bar view.
Note: Other chart types — Sales, Subscriptions, Learning Activity, Engagement, Instructor Earnings, and Popular Courses — appear here too, but they're PRO and show locked with an "Upgrade to Pro" overlay.
Filtering your data
Two controls in the toolbar change what the cards and chart show:
Date range
Click the date control to pick a period. The presets are:
| Preset | What it covers |
|---|---|
| Today | The current day. |
| Last 7 days / Last 14 days | The last 1–2 weeks. |
| Last 30 days (default) | The last month. |
| Last 3 Months / Last 12 Months | The last quarter / year. |
| Month to Date / Quarter to Date | From the start of this month / quarter. |
| Year to Date | From January 1 of this year. |
| All Time | Everything on record. |
You can also pick a custom range on the calendar (you can't select a date in the future).
Course filter
Use the course filter to focus the whole dashboard on one course. It defaults to All courses; start typing to search for a specific one. Only published courses appear.
Printing or saving as PDF
Click Print in the toolbar to print the current dashboard — or use your browser's "Save as PDF" option in the print dialog to keep a copy. Print is the only export option; there is no separate CSV/PDF download.
Tip: An Updating… badge appears briefly while the dashboard refreshes its numbers — the data is close to real time, so recent activity shows up quickly.
Who sees what
What appears on the dashboard depends on the user's role:
- Administrators and managers see data for all courses on the site.
- Instructors see data for only their own courses.
Free vs Pro
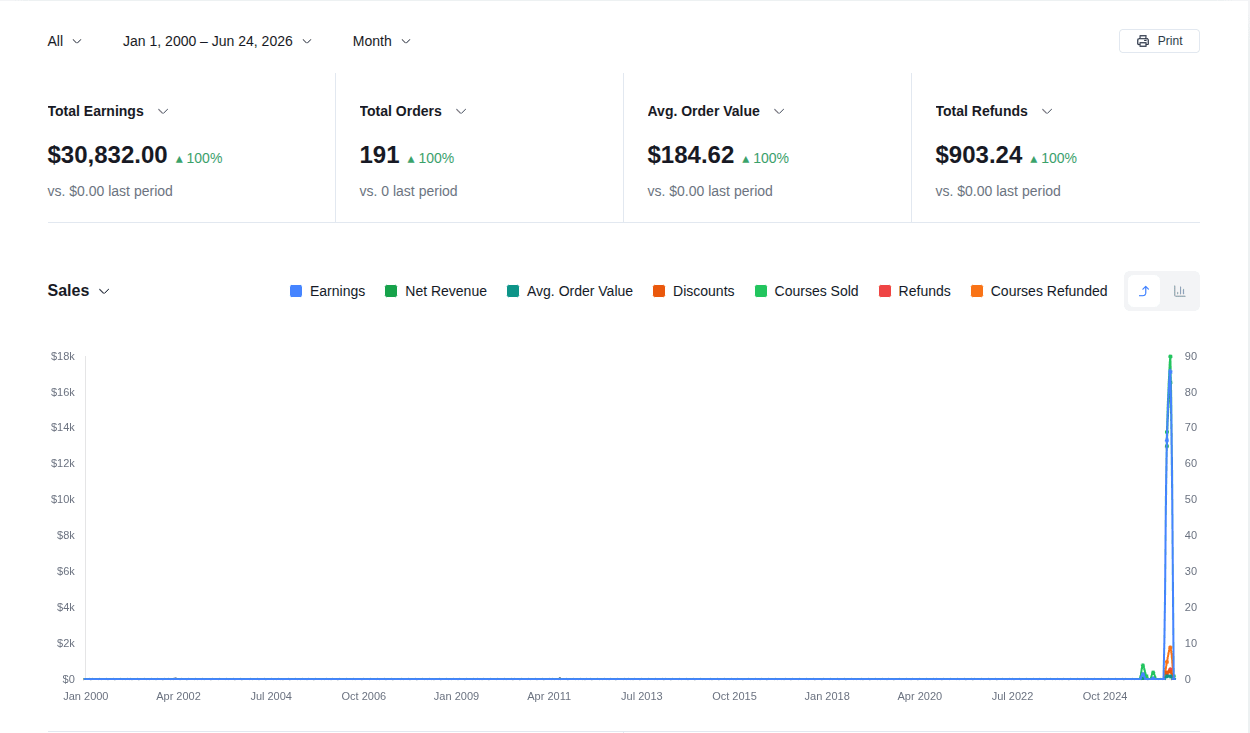
The free dashboard covers the essentials. Masteriyo Pro unlocks the sales metrics, every chart, comparisons, and deeper reports.
| Capability | Free | Pro |
|---|---|---|
| Content / People / Engagement metrics | ✓ | ✓ |
| Enrollment chart | ✓ | ✓ |
| Date range & course filter | ✓ | ✓ |
| Print / save as PDF | ✓ | ✓ |
| Sales metrics (earnings, refunds, orders, net revenue, AOV) | — | ✓ |
| All charts (Sales, Subscriptions, Learning Activity, etc.) | — | ✓ |
| Period-over-period comparison (▲/▼ % change) | — | ✓ |
| Customizable dashboard (add / remove / reorder, saved) | — | ✓ |
| Scope & bundle filters (All / Courses / Bundles) | — | ✓ |
| Per-course, student & instructor reports + commission | — | ✓ |
Note: Some Pro metrics depend on their add-ons — for example Total Certificates (Certificate), Total Assignments (Assignment), Total Groups (Group Courses), and Bundles Sold (Course Bundle).
Per-course analytics Pro
Beyond the site-wide overview, Masteriyo Pro lets you drill into a single course. The Courses analytics view lists every course with its key numbers (enrollments, revenue, rating), and from there you can open an individual course report showing that course's metrics, enrolled students and their progress, and a commission (instructor/admin) breakdown.
You can also open a course's report directly from Masteriyo > Courses — click the three dots on a course and choose Reports.
For the full walkthrough (with screenshots), see Advanced Analytics for Courses.
Frequently Asked Questions
Why don't I see sales or revenue numbers?
The Sales metrics and charts are a Pro feature. Upgrade to Masteriyo Pro to unlock them.
Why is a chart locked with an "Upgrade to Pro" overlay?
Only the Enrollment chart is in the free version. The other chart types are Pro.
As an instructor, why do I only see some of the data?
Instructors see analytics for their own courses only. Administrators and managers see data for all courses.
The numbers don't match what I expected.
Check the date range and the course filter at the top — the cards and chart only reflect the selected period and course. Data updates quickly but may take a moment to refresh (you'll see an Updating… badge).
Was this article helpful to you?
Give us Rating
Last edited on July 22, 2026.
Edit this page